


For example, they have quick access to a hidden menu that allows know advanced statistics while using your Fire TV.
Activate the “X-rays” of your Fire TV Stick
System X-Ray is a tool that helps internal and external developers identify application or system problems on Amazon Fire TV devices. As with other devices, this developer menu can also help you unlock full potential or access locked features.
After activating System X-Ray, a long rectangular overlay appears on the screen that shows different types of information, including information related to the type of image we are viewing, consumption of CPU, memory or network resources.
Indeed, it is as if we were accessing an x-ray of Fire TV inside and we knew the metrics of what we cannot see directly. You can invoke the Developer Tools menu in several ways.
Using the remote, on the directional pad, hold down the center button for one second; then (still holding Center), press the Down button as well. Hold down both buttons for about 3-4 seconds. Then release both buttons and press the Menu button on your controller. (If this doesn’t work, try holding Center and Down simultaneously instead of staggered.)
However, there is another way that is even easier and validated by Amazon. Just like reports AVPassionyou can use the controller and the official store to search for an app called “Developers Tool Menu Shortcut for Fire TV”. This will open the developer menu directly without the need for the remote key combination and will serve as a shortcut.
The screen section can show for example the HDMI mode, including the physical height of the screen in pixels and the refresh rate in frames per second. For example, if the screen shows “1080p 60”, it means that 1080 pixels is the physical height of the screen and 60 is the refresh rate in frames per second. You will also see what is the HDCP version (High-Bandwidth Digital Content Protection) that your Amazon Fire TV device uses to encrypt the content that is sent over the HDMI cable to the television.
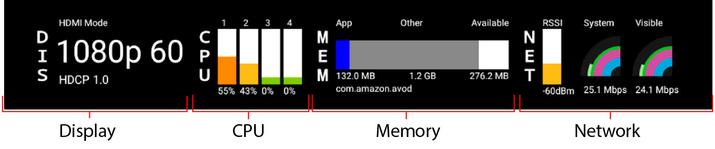
In the CPU section The percentage of CPU usage of each core of the device is displayed in real time with different colors. Each column represents a different nucleus. CPU usage is represented as follows:
- 0% to 33% (low utilization) is displayed in green
- 34% to 66% (moderate usage) is shown in orange
- 67% to 100% (high utilization) is shown in red
In it Memory section Through the Application (blue), Other (gray) and Available (white) labels, we can check the memory usage of the application in the foreground, of the rest of the applications and how much is left available to know if we are using up too many device resources.
The Network section displays WiFi signal strength along with download rates across the device and for the visible app, with indicators such as RSSI (Received Signal Strength Indicator)how many bits per second are actively downloaded to the device or how many bits per second the visible app is actively downloading.